
Understanding what your audience really wants can massively improve your marketing results. Nearly all B2B marketers (94%) say their conversion rates go up when they leverage user intent data. Ads targeted by intent are also 2.5× more efficient than untargeted campaigns. Whether you serve businesses or consumers, pinpointing user intent helps you create relevant, engaging experiences that drive action. The good news for small businesses is that you don’t need expensive software – you can gather intent insights using free or low-cost tools you likely already have. First-party data from web analytics, social media, search queries, email engagement, and surveys all offer windows into what your customers are seeking. Below is a practical guide to affordable methods for identifying user intent across major digital channels and how to use those insights to optimise content and user experience.

Organic Search: Analyse Search Queries for Intent Clues
Google Search Console’s “Queries” report shows the top search terms bringing people to your site.
How it reveals intent
Search queries are the questions or phrases users type when looking for something. By reviewing these, you discover why people are finding your site. For example, a broad query like “best accounting software” suggests a user in research mode, whereas a specific search for “QuickBooks vs FreshBooks” (especially if followed by visiting pricing pages) indicates someone close to a buying decision. In other words, the keywords users search reflect their goals and where they are in the journey.
Data/signals to look at: Use Google Search Console (GSC) (free) to see which queries lead to your pages, along with impressions, clicks, and average position. Look for:
- Common question phrases: If many people search things like “how to [solve X]”, it signals an informational intent – they seek guidance or answers.
- Branded or product-specific terms: Searches for specific products, models, or “[YourBrand] pricing” imply high commercial intent (these users may be ready to buy or compare options).
- Impressions vs clicks: Queries where you get lots of impressions but few clicks can highlight unmet intent. Perhaps your page isn’t fully answering that query. “If your page ranks for a keyword but doesn’t fully answer the searcher’s intent, you have an opportunity” to improve or create content that does growthmindedmarketing.com.
How to use the insights
Optimise or expand your content to better match the intent behind popular queries. For high-impression/low-click keywords, consider updating your page section or writing a new article that directly addresses that topic, growthmindedmarketing.com. For example, if people find your blog by searching “DIY plumbing tips” but leave quickly, maybe they wanted a step-by-step guide – adding a clear tutorial or video could satisfy them. Also, use tools like Google Trends to spot emerging interests. Google Trends (free) shows what topics are rising; you might discover a trending query (e.g. “long-wear lipstick for humidity” in a beauty niche) and create content to address it. By aligning pages with what searchers intend to find, you’ll improve engagement and SEO performance (Google rewards results that satisfy user intent).
Paid Advertising: Mine Ad Data for Intent Signals
How it reveals intent
Paid campaigns (especially search ads) provide granular data on what motivated users to click. In Google Ads, the Search Terms report lists the exact searches that triggered your ads. These terms often mirror different stages of intent – e.g. a generic search “laptop reviews” (browsing intent) vs. “buy Dell XPS 13 price” (strong purchase intent). Even in social ads, the way users interact can signal intent: which ad copy or creative drove not just clicks but conversions indicates what messaging resonates with high-intent buyers.
Data/signals to look at: If you run search ads, comb through the search queries that resulted in clicks or conversions. Key things to watch:
- High-converting keywords: Identify which search queries lead to conversions (purchases, sign-ups). These often have clear commercial intent. For example, if “buy [product] online” or “[product] discount code” are converting, those users were explicitly looking to transact.
- Low-intent broad terms: Notice broad searches that get clicks but no action – e.g. people clicking on “what is [product]” and bouncing. Those may be early-stage researchers. You can either tailor a gentler, informative landing page for them or add such terms as negative keywords to avoid wasting budget.
- Ad engagement metrics: Check click-through rates (CTR) and quality scores by keyword. A high CTR on specific terms suggests your ad matched user intent well. Google Ads rewards this alignment with better quality scores, meaning those keywords are worth focusing on. A low CTR or low time-on-site for certain ad keywords can indicate a mismatch (user intent not met by your ad or page).
How to use the insights
Double down on keywords that signal strong intent – allocate more budget to them, and ensure the ad copy and landing page directly address those users’ needs (e.g. highlight an offer or unique value for “buy now” searches). For lower-intent queries that are nonetheless important (like informational searches), consider creating content-based ads or remarketing: for instance, serve a helpful blog post via a sponsored link, then retarget those readers later when they show purchase signals. Also, use free tools like Google Keyword Planner (with a Google Ads account) to research related terms and see their search volumes. While Keyword Planner is meant for ad planning, you can glean which phrases have commercial indicators (high competition or suggested bid implies advertisers value that intent). Remember, focusing on intent can make your ad spend much more efficient – campaigns using intent data have been shown to deliver significantly higher ROI than untargeted ads. In a small-budget context, that means fewer wasted clicks and more qualified leads for every pound spent.
Social Media: Listen to Your Audience’s Needs
How it reveals intent
Social media is where customers often voice their thoughts, asking questions, seeking recommendations, or reacting to content. By listening to these conversations and analysing engagement, you can infer what your audience cares about or is looking for. A user asking “Can anyone recommend a good project management app for a small team?” in a LinkedIn group is signalling intent to find a solution. Likewise, someone commenting “I wish this product came in blue” on your Instagram post is hinting at a desire.
Data/signals to look at: Even with no paid tools, you can practice basic social listening:
- Comments and DMs: Pay attention to comments on your posts or direct messages. Are people asking for more details about a service? Complaining about a pain point? Frequently asked questions on social channels reveal what information or features users intend to find.
- Recommendation posts and keywords: Search social platforms (Twitter, Reddit, Facebook Groups, LinkedIn) for keywords like “recommendation, alternative, vs, looking for” alongside industry terms. These “buying intent triggers” (e.g. tweets like “looking for an alternative to Salesforce”) indicate users actively seeking a product or solution. Engaging with these posts or offering help can connect you with high-intent prospects.
- Engagement analytics: Use the free analytics built into platforms (e.g. Facebook Insights, Instagram Insights, Twitter Analytics) to see what content resonates. Look at which posts get shared or saved (signals of high interest), not just likes. For example, if your how-to video gets shared ten times more than your product promo, your audience’s intent at that moment might be to learn, not be sold to. On the other hand, a product demo that gets many comments like “Need this!” shows intent to purchase.
- Brand and competitor mentions: Set up simple alerts for when people mention your brand or competitors. A free tool like Google Alerts can notify you of discussions about specific keywords. You can also manually follow industry hashtags or competitor pages. If users are complaining about a competitor’s feature, that’s an opportunity to highlight how you address that issue.
How to use the insights
Feed these findings back into your content and engagement strategy. If social listening reveals a common question (e.g. many people ask if your software integrates with X), create a post or FAQ addressing it. Join conversations where people seek recommendations – in a helpful, non-spammy way – to position your brand as a solution. For instance, responding to someone asking for a “budget-friendly camera” with a useful tip (not just “buy mine”) builds trust and puts you on their radar. Also, schedule content that aligns with demonstrated interests: say your followers loved a recent infographic about sustainability, you now know there’s intent to learn more on that topic – so provide more of it. Social media polls are another free tool: don’t be afraid to directly ask your followers what they want to see or what problem they need solved. This not only engages your audience but gives you explicit intent data. Overall, by actively listening on social channels (even using free tools or basic searches), small businesses can uncover real-time insights into customer intent and sentiment that might not surface elsewhere.
Email Marketing: Gauge Intent from Email Engagement
How it reveals intent
Your email list can be a goldmine of intent signals because it’s composed of people who’ve already shown enough interest to subscribe or sign up. How these subscribers interact with your emails – what they open, click, or ignore – tells you a lot about their needs and stage in the buying journey. For example, a B2B prospect who consistently clicks on case study links in your newsletter might be evaluating solutions (strong intent), whereas one who only skims and never clicks could be in an early stage or losing interest.
Data/signals to look at: Most email marketing tools (Mailchimp, Sendinblue, etc., many with free plans up to a limit) offer basic analytics:
- Open rates and subject triggers: See which subject lines get higher open rates. If an email titled “How to improve X” vastly outperforms one like “New features of our product”, your audience might be telling you they’re more interested in learning solutions to X than hearing a product pitch. (Note: due to privacy changes, open rate is a rough metric, but trends can still be informative.)
- Click-through patterns: Pay close attention to which links people click inside your emails. This is a direct signal of intent. If you include multiple links (say, one to a blog post and one to a product page), and a segment of users always clicks the product page, they likely have higher purchase intent – perhaps consider sending them more product-focused content or an offer. Conversely, those clicking educational content may still be in research mode. Many email platforms let you tag or segment subscribers based on link clicks (e.g. everyone who clicked “Pricing Details” link can be marked as interested in pricing).
- Email reply or survey responses: If your emails encourage replies (e.g. “Let us know what you think”) or have a mini-survey, any responses are qualitative intent data. A reply like “Can someone call me to discuss this service?” is a clear high-intent signal. Even an out-of-office reply like “I’m interested, please follow up next week” is valuable – it shows intent to continue the conversation.
How to use the insights
Segment and personalise your follow-ups based on intent signals. For instance, if using Mailchimp or similar, create a segment for engaged prospects (those who click on sales-related links or open most emails) and send them more product offers, case studies or even personal reach-outs. Meanwhile, send a different stream of content to the less-engaged group – maybe a helpful tips series to warm them up. This kind of intent-based segmentation can dramatically boost results: one study found that targeting email campaigns by user intent (engagement) lifted click-through rates by 45% and generated 28% more qualified leads within three months. Even on a tiny budget, you can implement this by simply splitting your list and tailoring your messaging. Additionally, use email engagement data to optimise your content strategy outside of email – for example, if very few people click your “Product Updates” newsletter section but many click “Industry News,” consider adjusting the ratio of content, since that suggests what they intend to get from your emails. Lastly, keep an eye on unsubscribe reasons (if provided or via a quick exit survey); feedback like “too many emails” or “content not relevant” indicates a mismatch in intent that you can address by refining frequency or content topics.
Website Analytics & On-Site Behaviour: Interpret User Actions
How it reveals intent
Your own website analytics can show what users do once they’re on your site, which reflects their intent and interests. By observing user behaviour – which pages they visit, how long they stay, what they search for on your site – you can deduce what they were trying to accomplish. For example, a visitor who navigates from your blog to your pricing page and then to the contact form is demonstrating intent to evaluate or buy, whereas someone who reads three blog posts in a row might have an informational intent (researching broadly).
Data/signals to look at: Using a free tool like Google Analytics (GA) (or an open-source alternative like Matomo), you can gather insights such as:
- Top pages and paths: Identify the most-viewed landing pages and common click paths. Are visitors frequently ending up on your “Pricing” or “Features” page? Those pages are often high-intent (especially pricing) – if a user goes there, they’re likely considering your product/service seriously. GA’s Behaviour Flow or path analysis can show sequences; e.g. many users going Homepage → Product Page → Pricing is a strong buying signal. Ensure those high-intent pages have clear info and calls-to-action (CTA) to convert interested visitors.
- Bounce rate & time on page: Look at bounce rates for landing pages. A high bounce on a page might mean it didn’t meet the user’s intent, or they found what they needed very quickly. For instance, if a blog post answering a quick question has a high bounce but also a short time on page, perhaps the user got their answer and left satisfied. If time on page is long and bounce is high, maybe they were engaged but didn’t see obvious next steps – consider adding internal links or a CTA to guide them. Session duration and pages per session similarly indicate engagement; multiple pages viewed suggest a deeper interest in your content or offerings.
- On-site search queries: If your site has a search bar, this is a direct line to user intent. Review what visitors type into your site search (GA can track this under Site Search reports). These queries often reveal exactly what users still want after landing. For example, an e-commerce site might find many searches for “return policy” – highlighting that customers intend to find that info, and maybe it’s not prominent enough. Or a blog might see searches for “case studies” – indicating users (perhaps B2B prospects) want real-world examples. Use this data to make popular search items easier to find via menus, or create new content if people search for something you don’t have.
- Conversion funnels and drop-offs: Examine any goal funnels you have (for instance, steps to sign up or checkout). Where users drop off in a process signals where their intent was thwarted. If many add to cart but abandon at shipping details, maybe the shipping cost wasn’t clear (their intent to purchase was there, but a friction point stopped them). These drop-off points show intent to do something that got interrupted – an opportunity to fix UX issues or provide better info.
How to use the insights
Treat your analytics like a detective kit. If web analytics show certain pages are hotspots of intent, focus your optimisation efforts there – add FAQs, improve load time, make CTAs more obvious. A practical example: if GA reveals your “Contact Us” page has a high exit rate, users might be looking for information that isn’t there (pricing? phone number?). Adding those details could better serve their intent. Another example: if site search data shows many queries for “login” or specific product names, ensure your navigation is clear (maybe add a “Login” button or a dedicated product page). Also consider setting up event tracking for micro-conversions that signal intent, such as PDF downloads, video plays, or “add to wishlist” clicks – these actions imply interest in your content or products. All of this data can be used to personalise the user experience; for instance, showing related products or content based on what someone viewed can guide them further along their intended path. As Artisan’s marketing team advises, page views, repeat visits, form submissions, and click-through rates are all valuable intent clues that reveal a prospect’s interests and stage in the buyer journeyartisan.co. By analysing these behaviours, even a small business can continuously refine its website to anticipate and meet user needs (often at no cost aside from your time).
Session Recordings & Heatmaps: Watch and Learn (Visually)
How it reveals intent
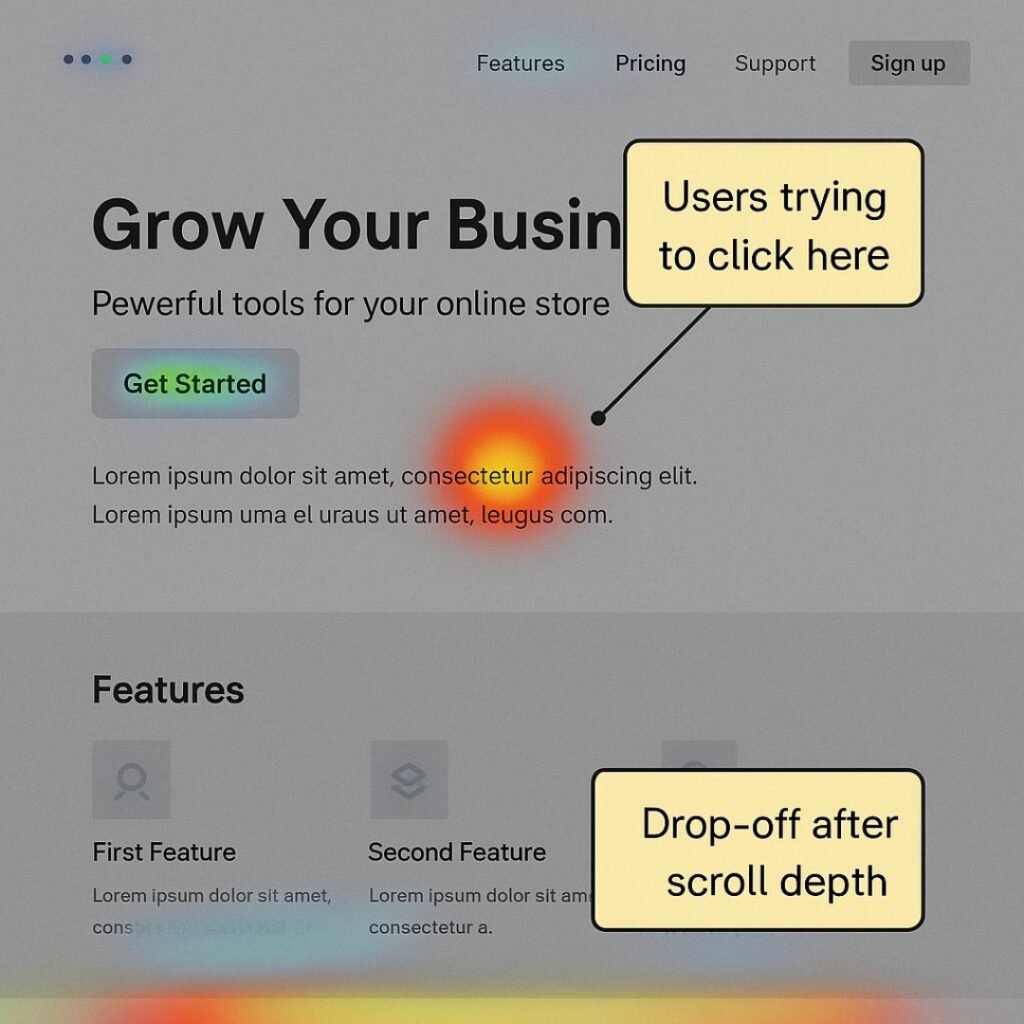
Sometimes, numbers alone don’t tell the full story of user intent. Session replay tools (like Hotjar or Microsoft Clarity, which has a completely free plan) let you watch recordings of real user sessions on your site, seeing where they move the mouse, what they click, and where they get stuck. Heatmaps aggregate this data to show hot spots of clicking, scrolling, or mouse movement. These qualitative insights can expose user intentions and frustrations in a very direct way. For example, if you notice several recordings of users repeatedly clicking a non-clickable element (a classic “rage click”), it reveals an intent – they thought it was a button or link and wanted to take an action that wasn’t happening.
Data/signals to look at: Many of these tools have freemium versions (Hotjar offers limited free recordings/heatmaps; Clarity is free and unlimited). Once installed, look for patterns such as:
- Rage clicks & u-turns: As mentioned, rage clicks (multiple rapid clicks on the same spot) show frustration. Hotjar even visualises these with a rage-click heatmap. For instance, if users rage-click an image or headline, they likely expect it to lead somewhere – a sign you should make that element a link or clarify it. Clarity similarly flags “dead clicks” (clicks on non-interactive parts). Also watch for mouse movements indicating hesitation or abrupt bounces – e.g. a user moves the mouse back and forth, then leaves the page; something likely prevented them from finding what they intended.
- Scroll depth heatmaps: These show how far down people scroll on a page. If most users only scroll 25% down a page, perhaps the content below isn’t relevant or the page is too long for their intent. Alternatively, if users scroll all the way consistently, it means they’re interested in the content. Use this insight to decide where to place important information. For example, if only 50% of visitors reach your pricing table because it’s low on the page, you might surface some pricing info higher up for those intending to find it.
- Click maps: A click heatmap highlights the elements that get the most clicks (e.g. a particular button, navigation item, or image). This reveals what users want to interact with. Are a lot of clicks happening on “Download demo” or a certain product filter? That’s a clear expression of interest – make those experiences as smooth as possible. Conversely, if an important link or button has few clicks (cold spot on the heatmap), maybe users aren’t noticing it or don’t find it relevant – you might need to redesign or reposition it.
- Session replays of drop-offs: Filter recordings to focus on users who dropped off at key points (like abandoned cart sessions, or form abandons). Watching a replay, you might notice, for example, the user moved their mouse around looking for a coupon field – indicating an intent to find a discount – and then left when they didn’t find one. Such observations can directly inform UX tweaks (in this case, maybe highlight available discounts or clarify pricing).
How to use the insights
Heatmaps and recordings provide a visual, empathetic view of user intent. Use them to see what users are trying to do. For instance, if recordings show several users scrolling up and down a FAQ page searching for a particular answer, that tells you their intent (that question is common) and that you should perhaps make it more prominent or easier to find. Hotjar’s mantra is to use these tools to remove friction and improve conversion. When you see what grabs users’ attention or what they completely miss, you can adjust your design accordingly. If you find on recordings that users stop at a certain form field consistently, perhaps that field is confusing (their intent to complete the form gets blocked there) – consider rewording or removing it. Heatmap insights should be paired with analytics: e.g., analytics might show a page has a high exit rate, and the session replays could reveal why (users may be clicking something that doesn’t work, etc.). As one guide for small businesses notes, these tools “vividly illustrate user engagement” and, combined with feedback, offer clarity on customer preferences and pain points – arming you with actionable data to make informed changes. The best part: you can often implement Hotjar or Clarity for free, and just a handful of session observations can yield big UX wins that help users accomplish their goals.
Surveys & Feedback: Ask Users Directly
How it reveals intent
Sometimes, the simplest way to know what users want is to ask them. Collecting direct feedback via surveys, polls, or feedback widgets can confirm user intent or uncover needs that aren’t obvious from behavioural data. For example, an on-site exit survey asking “Did you find what you were looking for?” can immediately tell you if a user’s intent was satisfied. A response like “No, I was looking for pricing info” is invaluable – it highlights a gap between user intent and your content. While surveys require a bit more user effort, many customers (especially in B2B) are willing to share if they think it will lead to improvements.
Methods and tools (mostly free):
- On-site polls/surveys: Use free tools like Google Forms or a freemium tool like Hotjar Surveys to embed quick questions on your site. You might target specific pages – e.g. on a product page, pop up a one-question survey: “Is there anything preventing you from purchasing today?” If many respond about missing specs or unclear pricing, you’ve identified precisely how to adjust content to meet their intent. Keep surveys short and optional. Even a yes/no or multiple-choice can yield insight (e.g. “What were you primarily looking for on our site today? 1. Pricing info, 2. Technical specs, 3. Customer reviews, 4. Other”).
- Feedback widgets: Some tools offer a passive feedback tab (like “Was this page helpful? [Yes/No]”). A No vote (often with an option to explain why) signals unmet intent – perhaps the page didn’t answer their question. If you see common themes in the why-not feedback (“didn’t find opening hours”), you can act on it. A Net Promoter Score (NPS) widget for customers is another variant – while primarily measuring satisfaction, the comments users leave often reveal intent or expectations (“I expected feature X to do Y…”).
- Email or social surveys: You can also ask your audience directly in email newsletters or via social polls about their interests or needs. For instance, a SaaS startup might email a short survey (with an incentive like a discount draw) asking, “What’s the #1 thing you’re looking for in [product category] solutions?” The answers will directly voice user intent (e.g. “ease of use”, “24/7 support”, etc.), which can guide your messaging and feature emphasis.
How to use the insights
Incorporate what you learn back into your strategy and site experience. If a significant number of users say they didn’t find what they needed, identify where the disconnect is – do you need a new FAQ page? Better site navigation? More transparent info? Surveys can also validate whether the changes you made actually addressed user needs (run the same question again after an update to see if the “yes, I found it” rate improves). Keep in mind, surveys capture explicit intent signals – users telling you their purpose or problem in plain words, which complement the implicit signals from analytics. For a holistic view, combine both. As one small-business expert notes, survey results, web analytics, social and search data together give a comprehensive understanding of what your customers are considering and looking for. Finally, show that you’re listening: if users express a particular need en masse, consider creating content or even new offerings around it. For example, if multiple prospects via a survey say they’re interested in a cheaper/basic version of your product, that’s a strategic insight. Even if you can’t fulfil every request, acknowledging common feedback (e.g. a blog post “You asked for X, here’s our take…”) can turn intent data into engagement and goodwill.
Bringing it all together
By using these low-cost methods across search, ads, social, email, and your website, you can build a rich picture of user intent without breaking the bank. The key is to actively listen to the signals – in click data, in user behaviour, and in direct feedback – and then act on those insights. Optimising your marketing with intent in mind means you’re meeting your audience where they are: providing the answers, reassurance, or offers they seek. This not only improves your conversion rates and ROI, but also creates a better experience for your users. When a small business consistently delivers what people are looking for, it can compete with far larger players on user experience alone. In short, being attuned to user intent (using free tools like Google Search Console, Analytics, Hotjar/Clarity, social listening, and good old-fashioned surveys) helps you work smarter – focusing your limited resources on what truly matters to your customers, and yielding data-driven results you can show off in the boardroom. Happy optimising, and may your newfound intent insights guide you to higher engagement and success!